Alerts that think before they wake you
Anaphora harvests screenshots and raw numbers from Kibana, Grafana, Metabase and any web app, and hands all of it to an AI that looks at the dashboards the way you would, connects what it sees across sources into one picture, and pages a human only when the evidence says so.
🔭 Harvest every signal
Screenshots, tables and raw values from Kibana, Grafana, Metabase or any authenticated web app, on a schedule. A real browser that logs in like a human: if you can see it, it can capture it.
🧠 Triage with rules and AI
Fixed thresholds, calculated baselines and an AI that sees every snapshot as an image, alone or together. The AI connects the Kibana error spike to the Grafana latency graph and the Metabase order count. Nothing to act on: the job stops and nobody is paged.
📊 Reports and alerts, delivered
Branded PDF reports by email, or Slack, email and webhook alerts routed to the team that has to act.
- ✓ Kibana, Grafana, Metabase
- ✓ Any authenticated web app
- ✓ Screenshots and raw values
- ✓ AI reads dashboards as images
- ✓ Pages only when it matters
- ✓ Bring your own LLM, budgeted
- ✓ Slack, Email, Webhook, S3
- ✓ SSO, LDAP, Spaces
An animation in five scenes. One: Anaphora signs in to Kibana, Grafana and Metabase every five minutes and takes screenshots. Two: fixed thresholds, calculated baselines and an AI that reads the charts judge them together. Three: on a normal day every rule passes, the severity is 2 and nobody is woken up. Four: in an incident a threshold trips, orders fall under the baseline, and the AI connects errors, latency and orders into one cause. Five: only then is on-call paged, with severity 8, the reason and the screenshots attached.
Your dashboards are so powerful.
But a threshold alert cannot tell an incident from a Tuesday
Static rules watch one number at a time. They fire at 3 a.m. and leave the reasoning to whoever picks up the phone. Anaphora captures the dashboards, the numbers and the context, and lets an AI look at the charts, connect the dots across Kibana, Grafana and Metabase, and reason about all of them together before anyone is woken up.
Try AI triage now
From Dashboards to Decisions
Four steps from raw dashboards to a report, or an alert that is worth reading
Capture
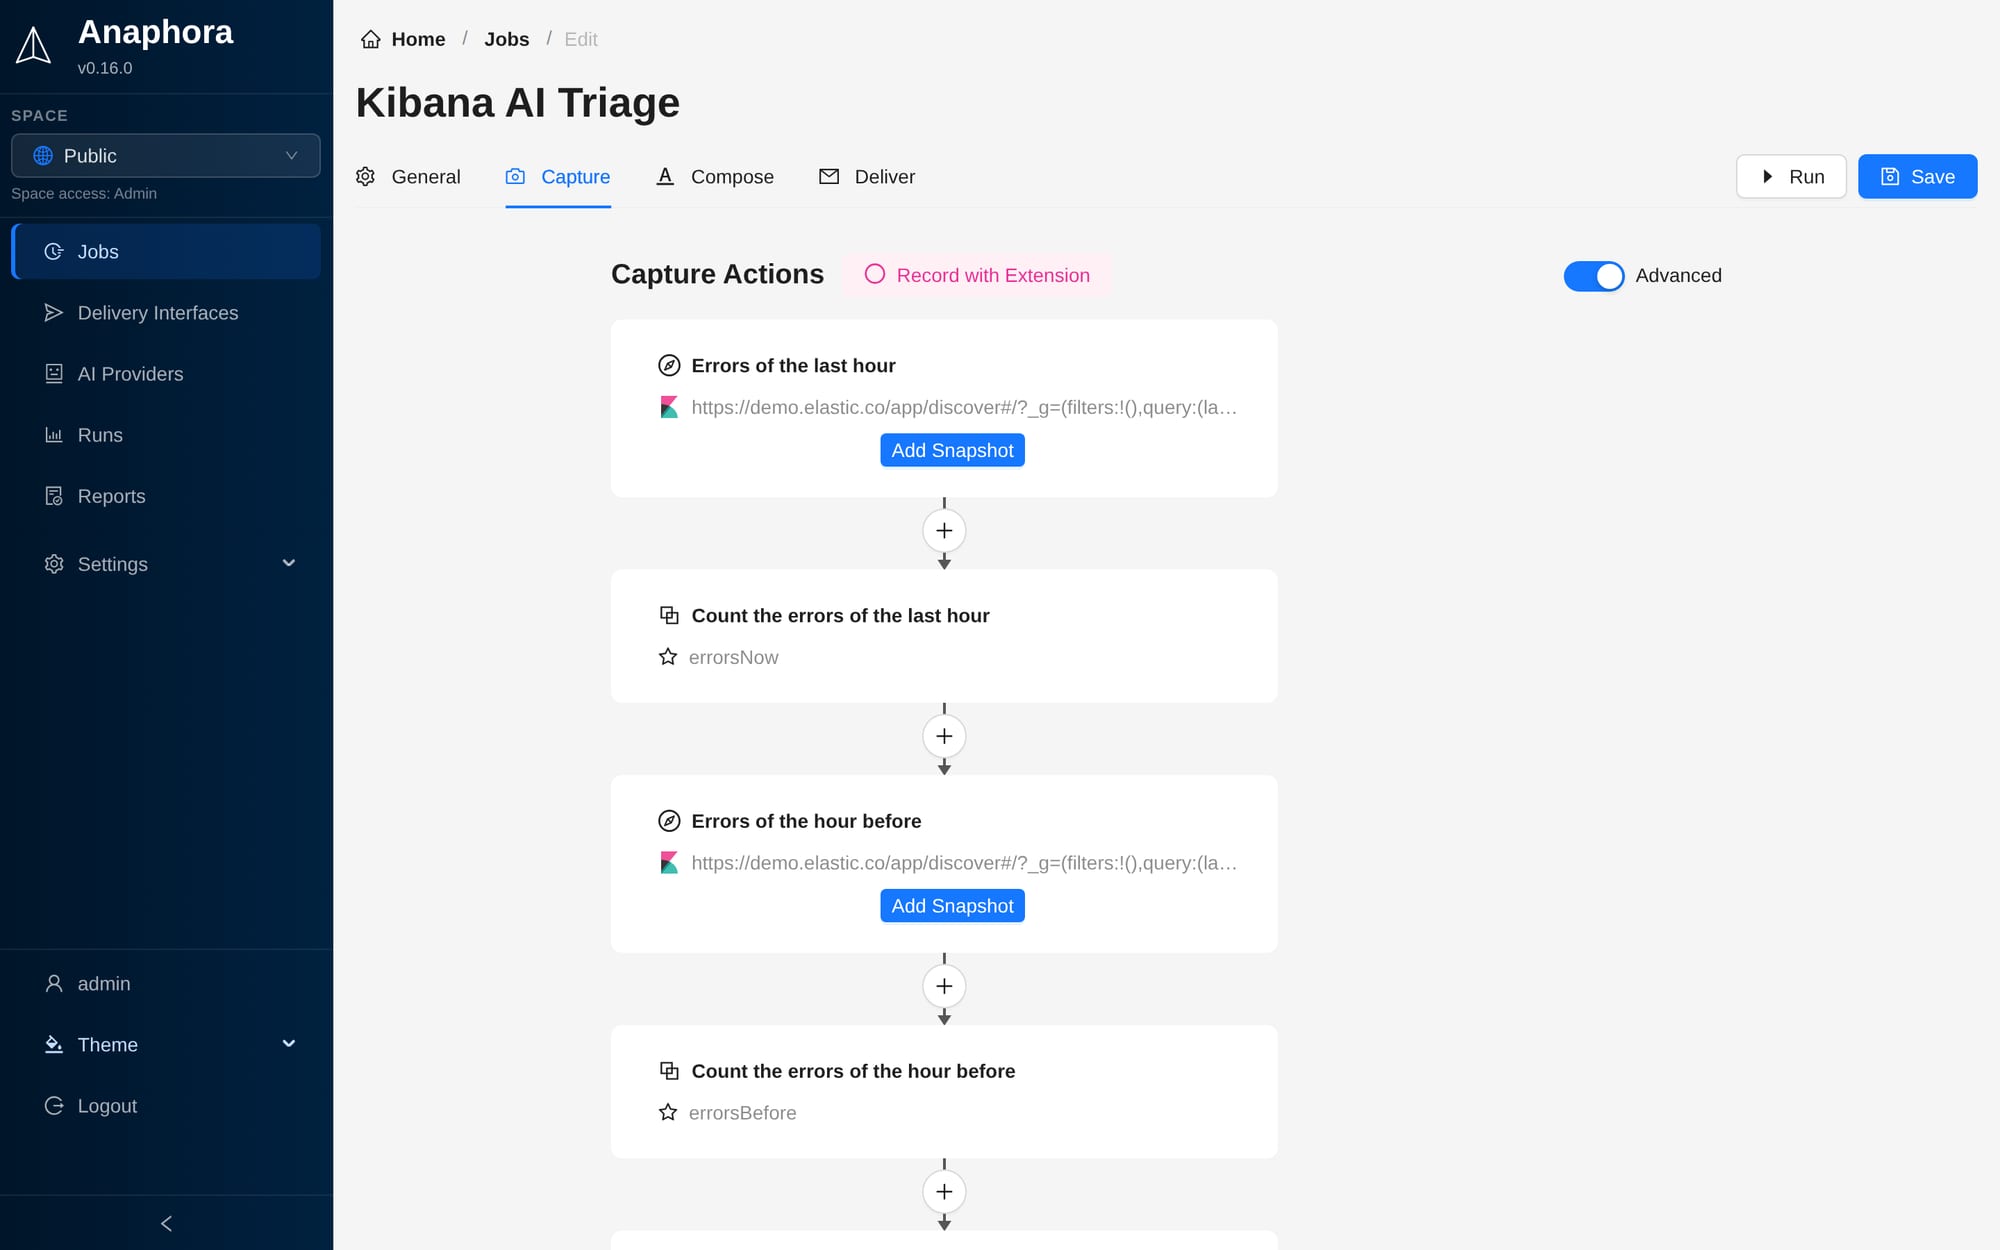
Screenshots, tables and raw values from Kibana, Grafana, Metabase and any authenticated web app, built as a visual flow.
Learn moreReason
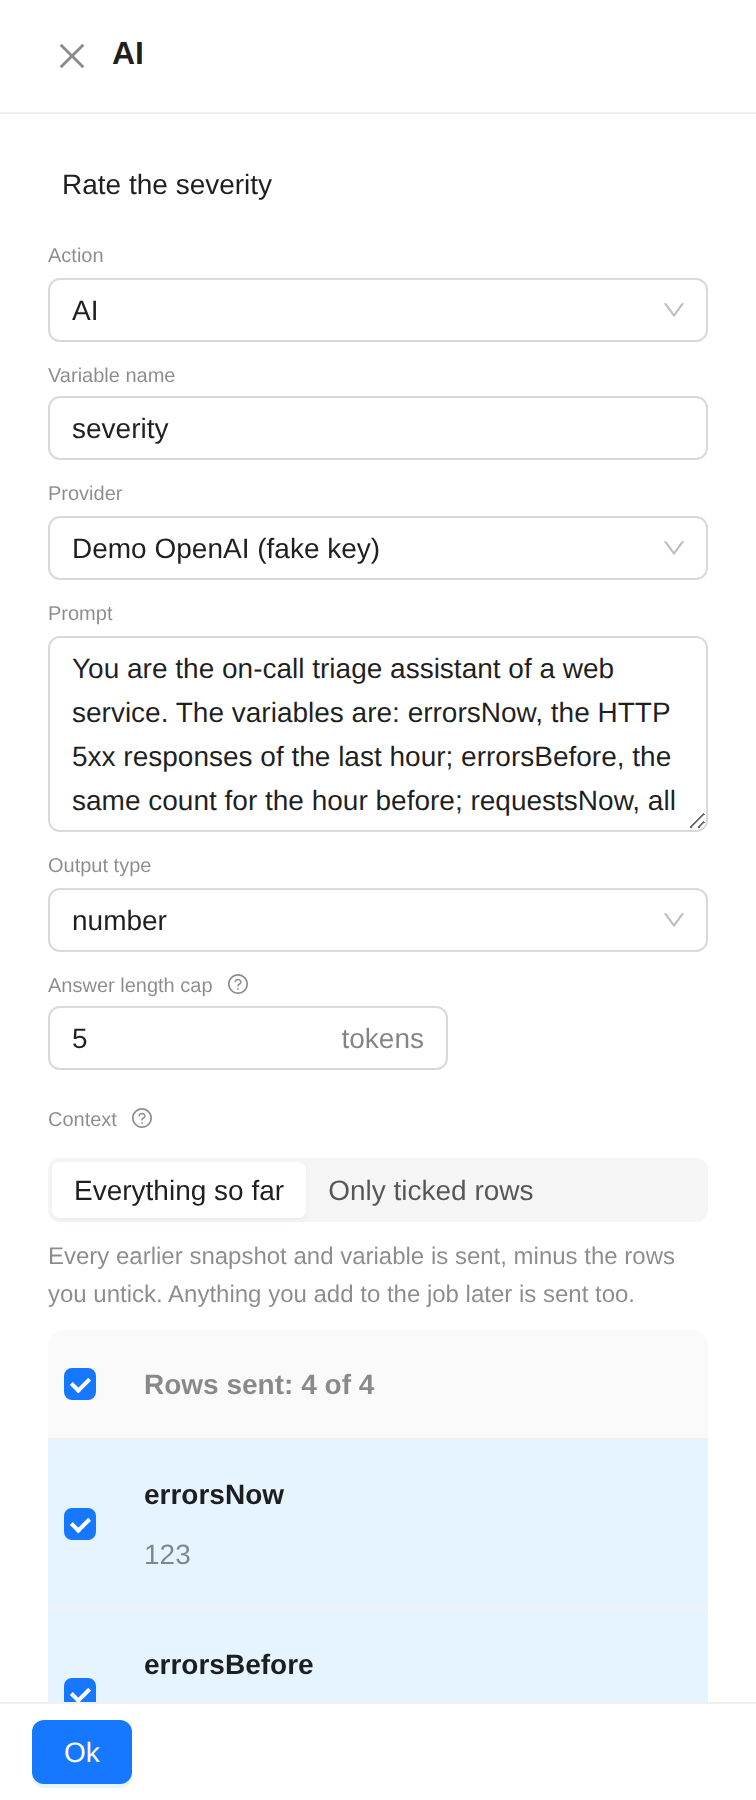
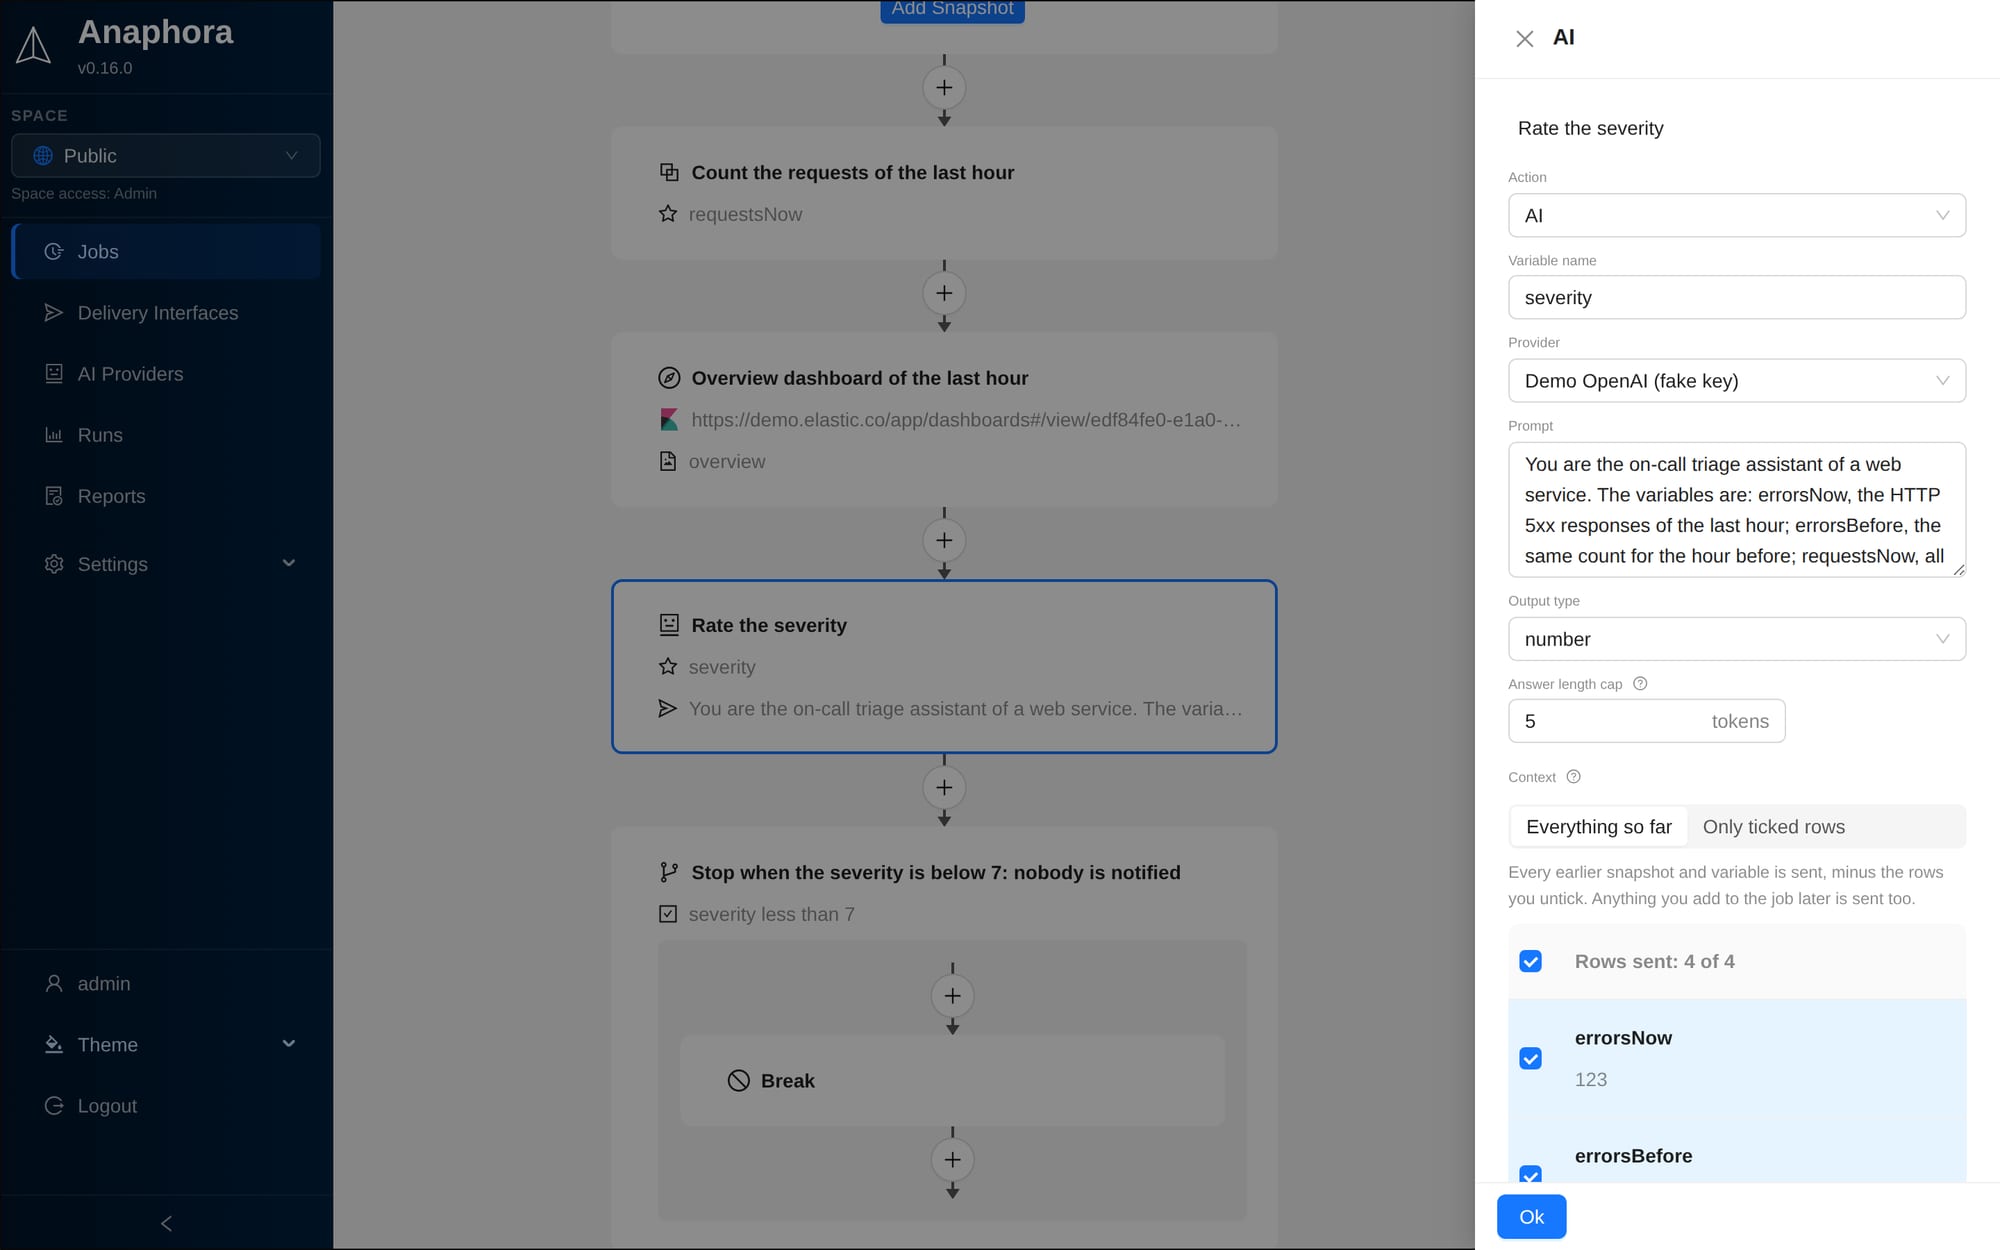
Every snapshot and number of the run goes to the AI, dashboards as images included. Ask for a severity score and branch on it: the job stops when nothing needs a human.
Learn moreCompose
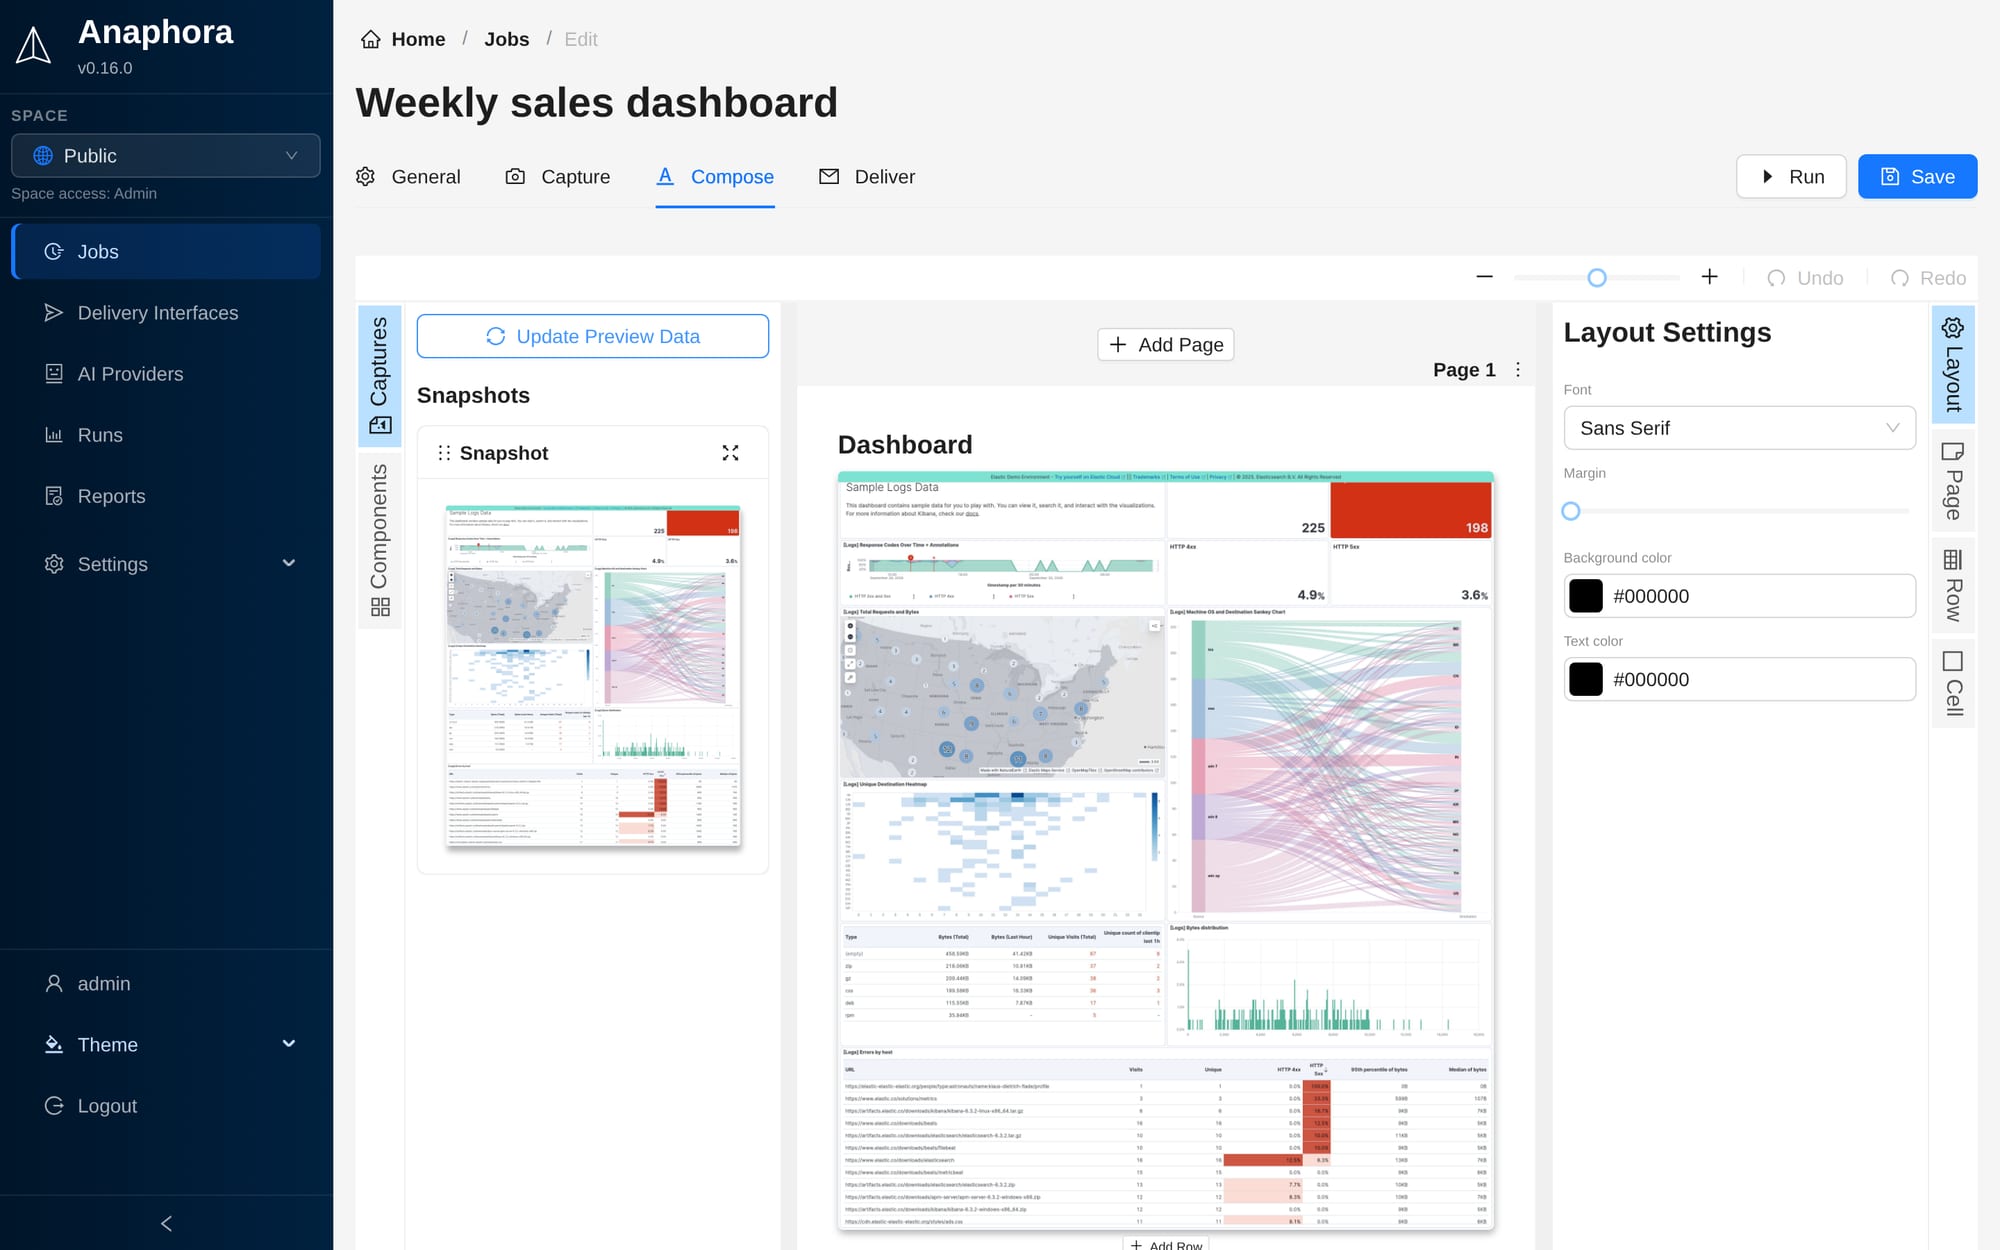
Drag screenshots, live values and AI-written text into a branded, print-ready layout.
Learn moreDeliver
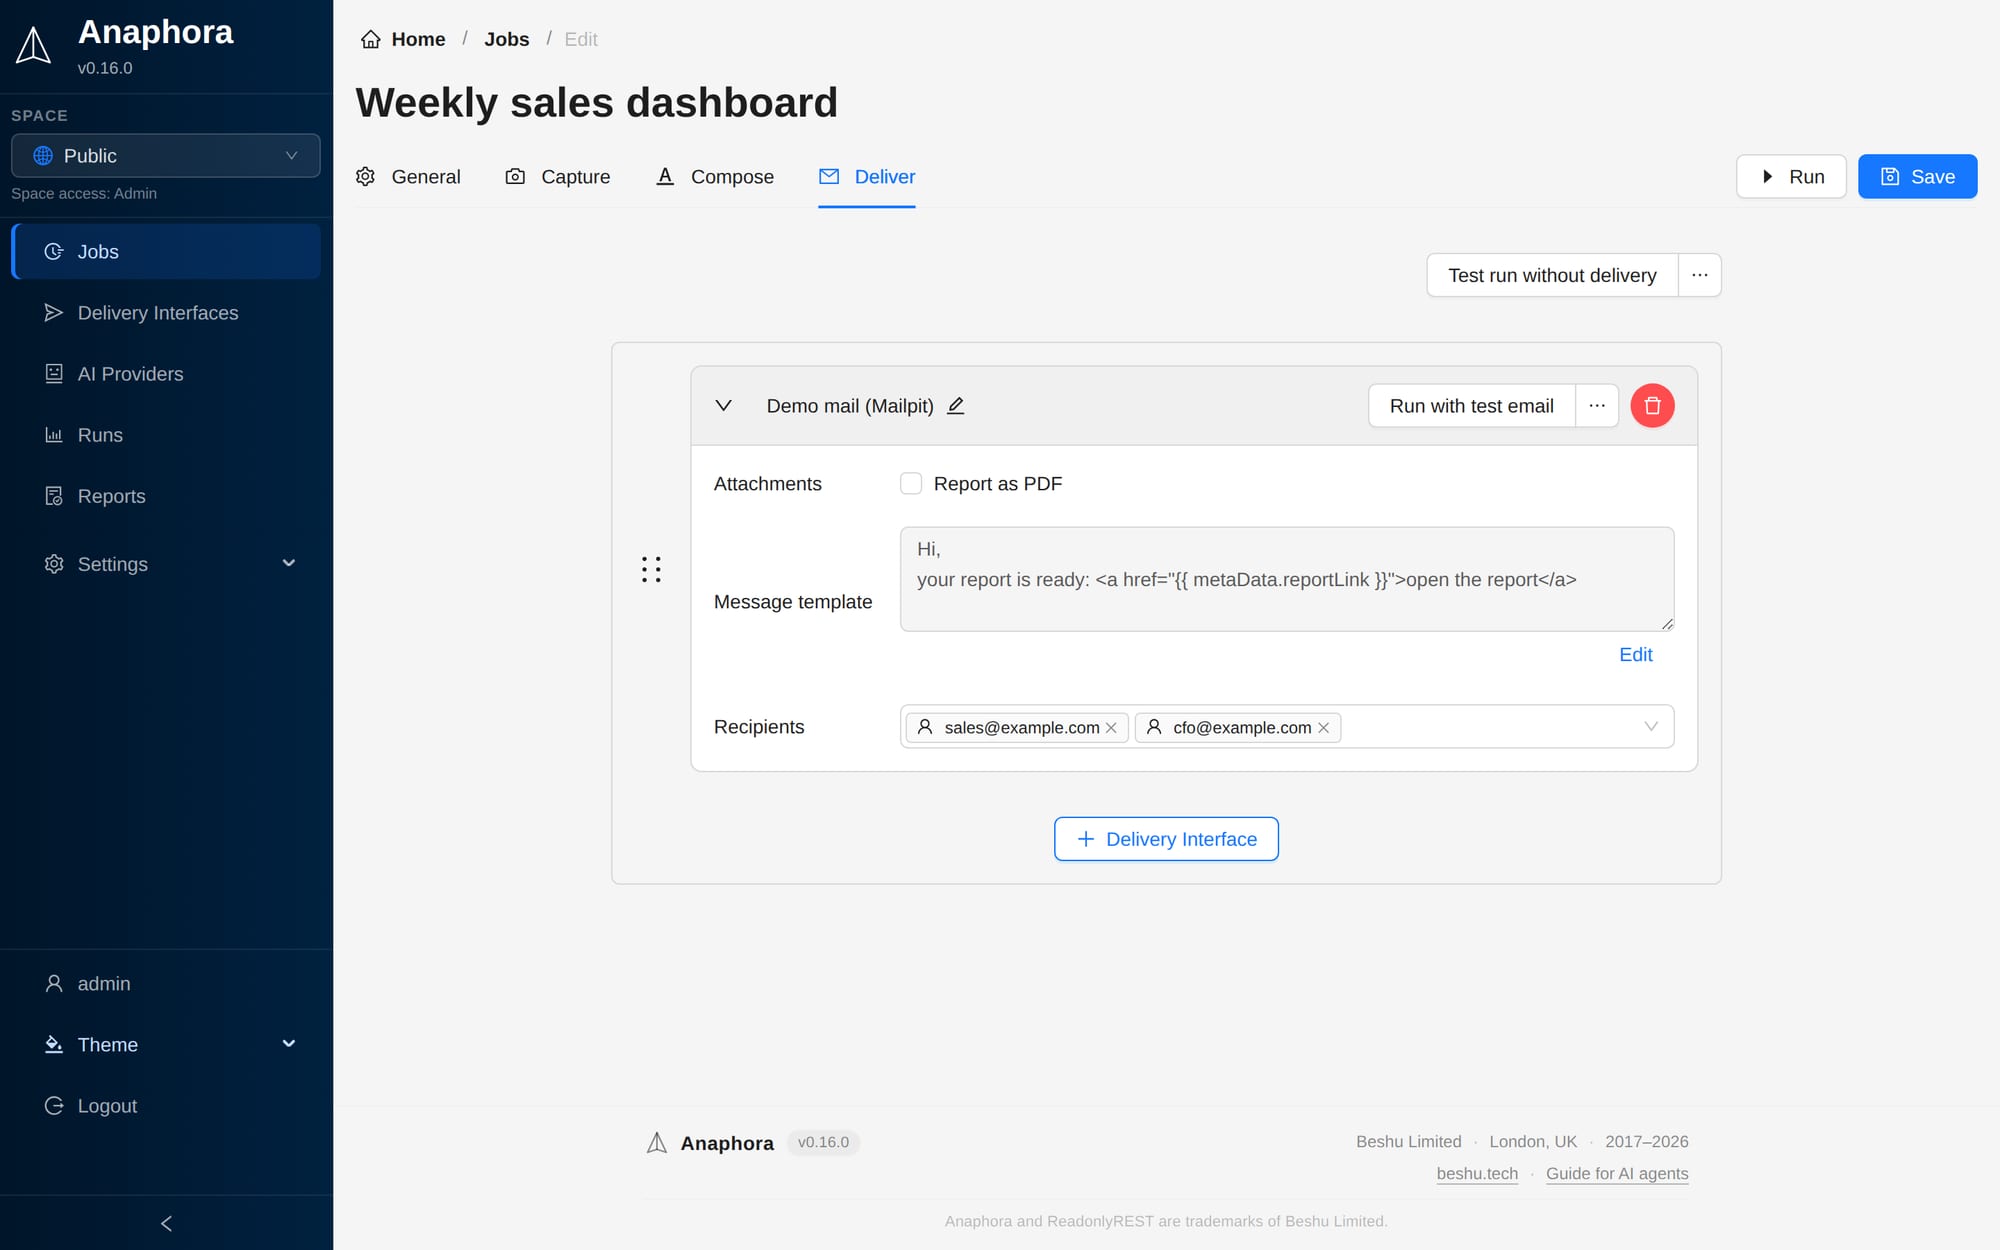
Slack, email, webhooks and S3, with throttling against notification fatigue. Only what matters reaches the team that has to act.
Learn moreHow Anaphora Works
Connect every dashboard, let an AI see the dashboards and reason about all of them together, and notify the right team only when action is needed.
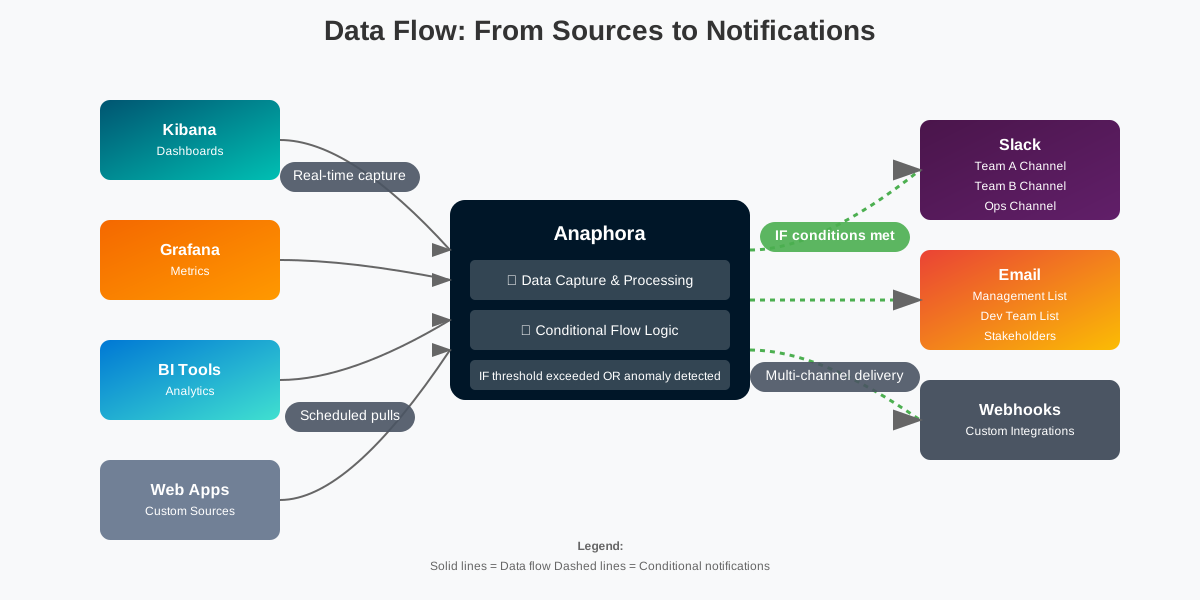
🔌 Multiple Sources
Kibana, Grafana, Metabase, BI tools and any web application, with authentication support. Screenshots and raw values alike.
🧠 AI Triage
One AI action looks at every dashboard of the run as an image, reads the raw values, and builds one picture across sources before it decides what it means. Combine it with thresholds and anomaly rules, without coding.
📢 Targeted Delivery
Route notifications to specific Slack channels, email lists or webhooks based on what the AI and your rules concluded
Trusted by
We are Beshu Limited
Our products are trusted across various sectors:
📈 Fortune 500 Companies
Powering data-driven decisions at the highest levels of business
🧸 Non-Profit Organizations
Supporting missions that make a difference in people's lives
⚛️ Research Institutions
Facilitating groundbreaking scientific discoveries
🇪🇺 Governmental Bodies
Enhancing efficiency in public sector operations
👮♀️ Security Agencies
Bolstering data security and intelligence capabilities
🏦 Financial Institutions
Observability for financial operations
What Our Customers Say

"From dashboards to decision-ready PDFs—automatically. Anaphora is the missing link between dashboards and stakeholders:"
- Captures from authenticated applications
- Produces clean, professional PDFs
- Delivers via email, S3 and webhooks
- Runs beautifully in Docker
- Integrates with LDAP/SSO for RBAC
"Rock-solid in production—an essential part of our reporting workflow."