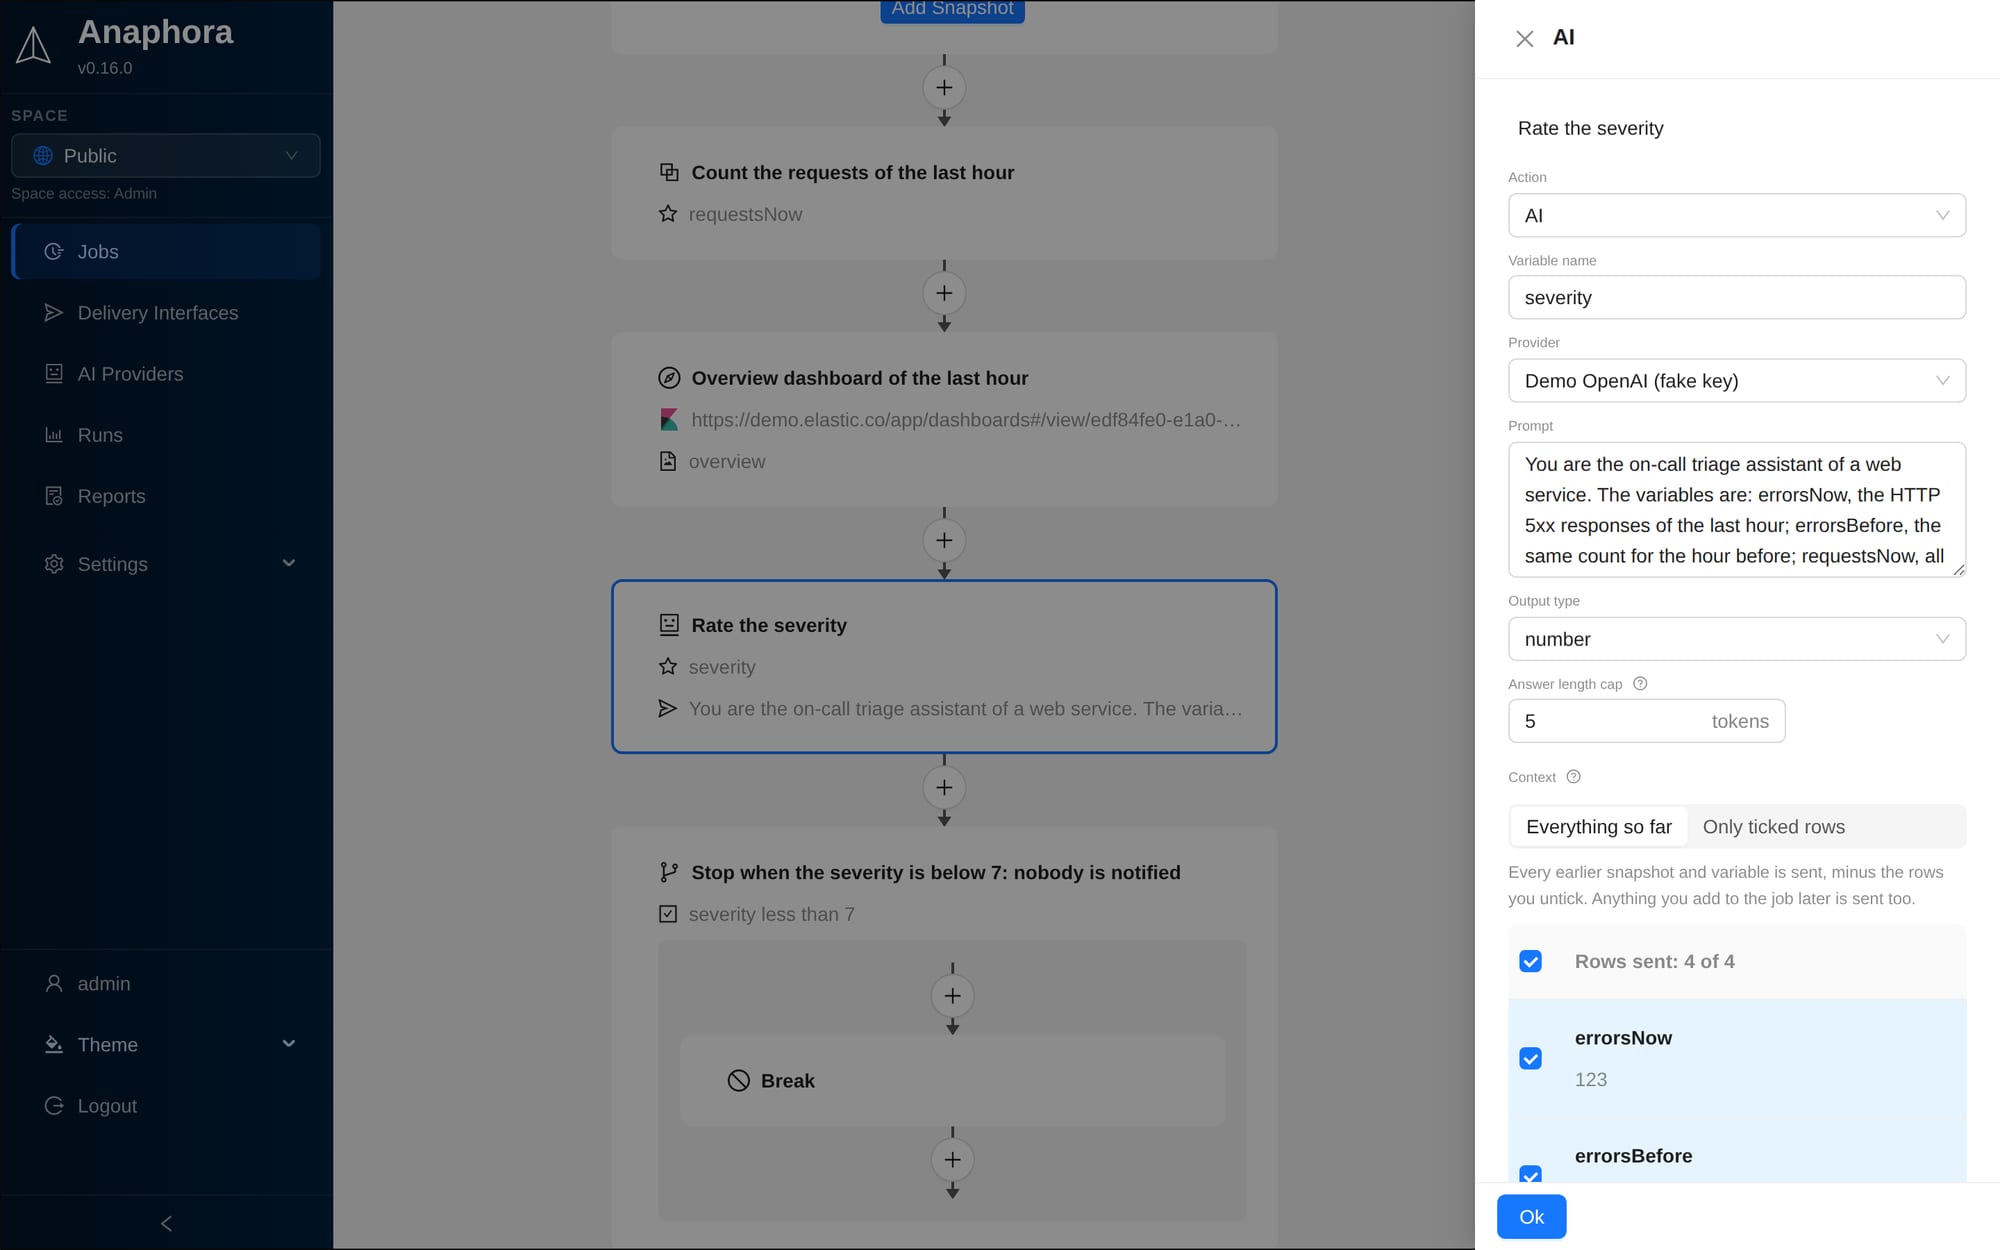
An illustrative scenario. The company, the people and the numbers are invented to show what an Anaphora job with an AI step does in practice. The job itself is real: it ships as the Kibana AI Triage template.
The cost nobody puts on a slide
Nordwind Parcel runs a tracking API that partners and mobile apps hit around the clock. Four platform engineers keep it up. One of them carries the pager each week.
In August the pager went off 41 times at night. The team went back through every page and sorted them:
| What it was | Pages | Should anyone have been woken? |
|---|---|---|
| A traffic surge: a marketing push, a partner batch | 17 | No |
| A late deploy with a two-minute error blip | 9 | No |
| A partner sending broken requests | 5 | Not at 3 a.m. |
| A real failure | 4 | Yes |
| The logs stopped arriving, so everything read zero | 6 | Yes, and the alert never fired |
Four pages out of 41 were worth a night's sleep. The alert was right one time in ten, and it was blind to the one failure that hurt most: when the logging pipeline died, the error count read zero, and zero looks like peace.
The team was tired. Two of the four had said, in separate one-to-ones, that on-call was the reason they were looking around. That is the cost: not the 41 interruptions, the two engineers.
Why the alert could not be tuned
The alert was a rule: more than 200 server errors in an hour, page someone. Every engineer knew how to judge such a page within a minute of opening the laptop. They looked at three things next to each other:
- Are errors up because traffic is up? Then it is load, not a fault.
- Are errors up while traffic is flat? Then something broke.
- Did a deploy happen in the last ten minutes? Then it is probably the release, and it usually settles by itself.
No threshold can hold that judgement. Raise the number and the small failures at 3 a.m. never page. Lower it and the surges page more. The judgement lives in a person, so a person gets woken to apply it.
What changed
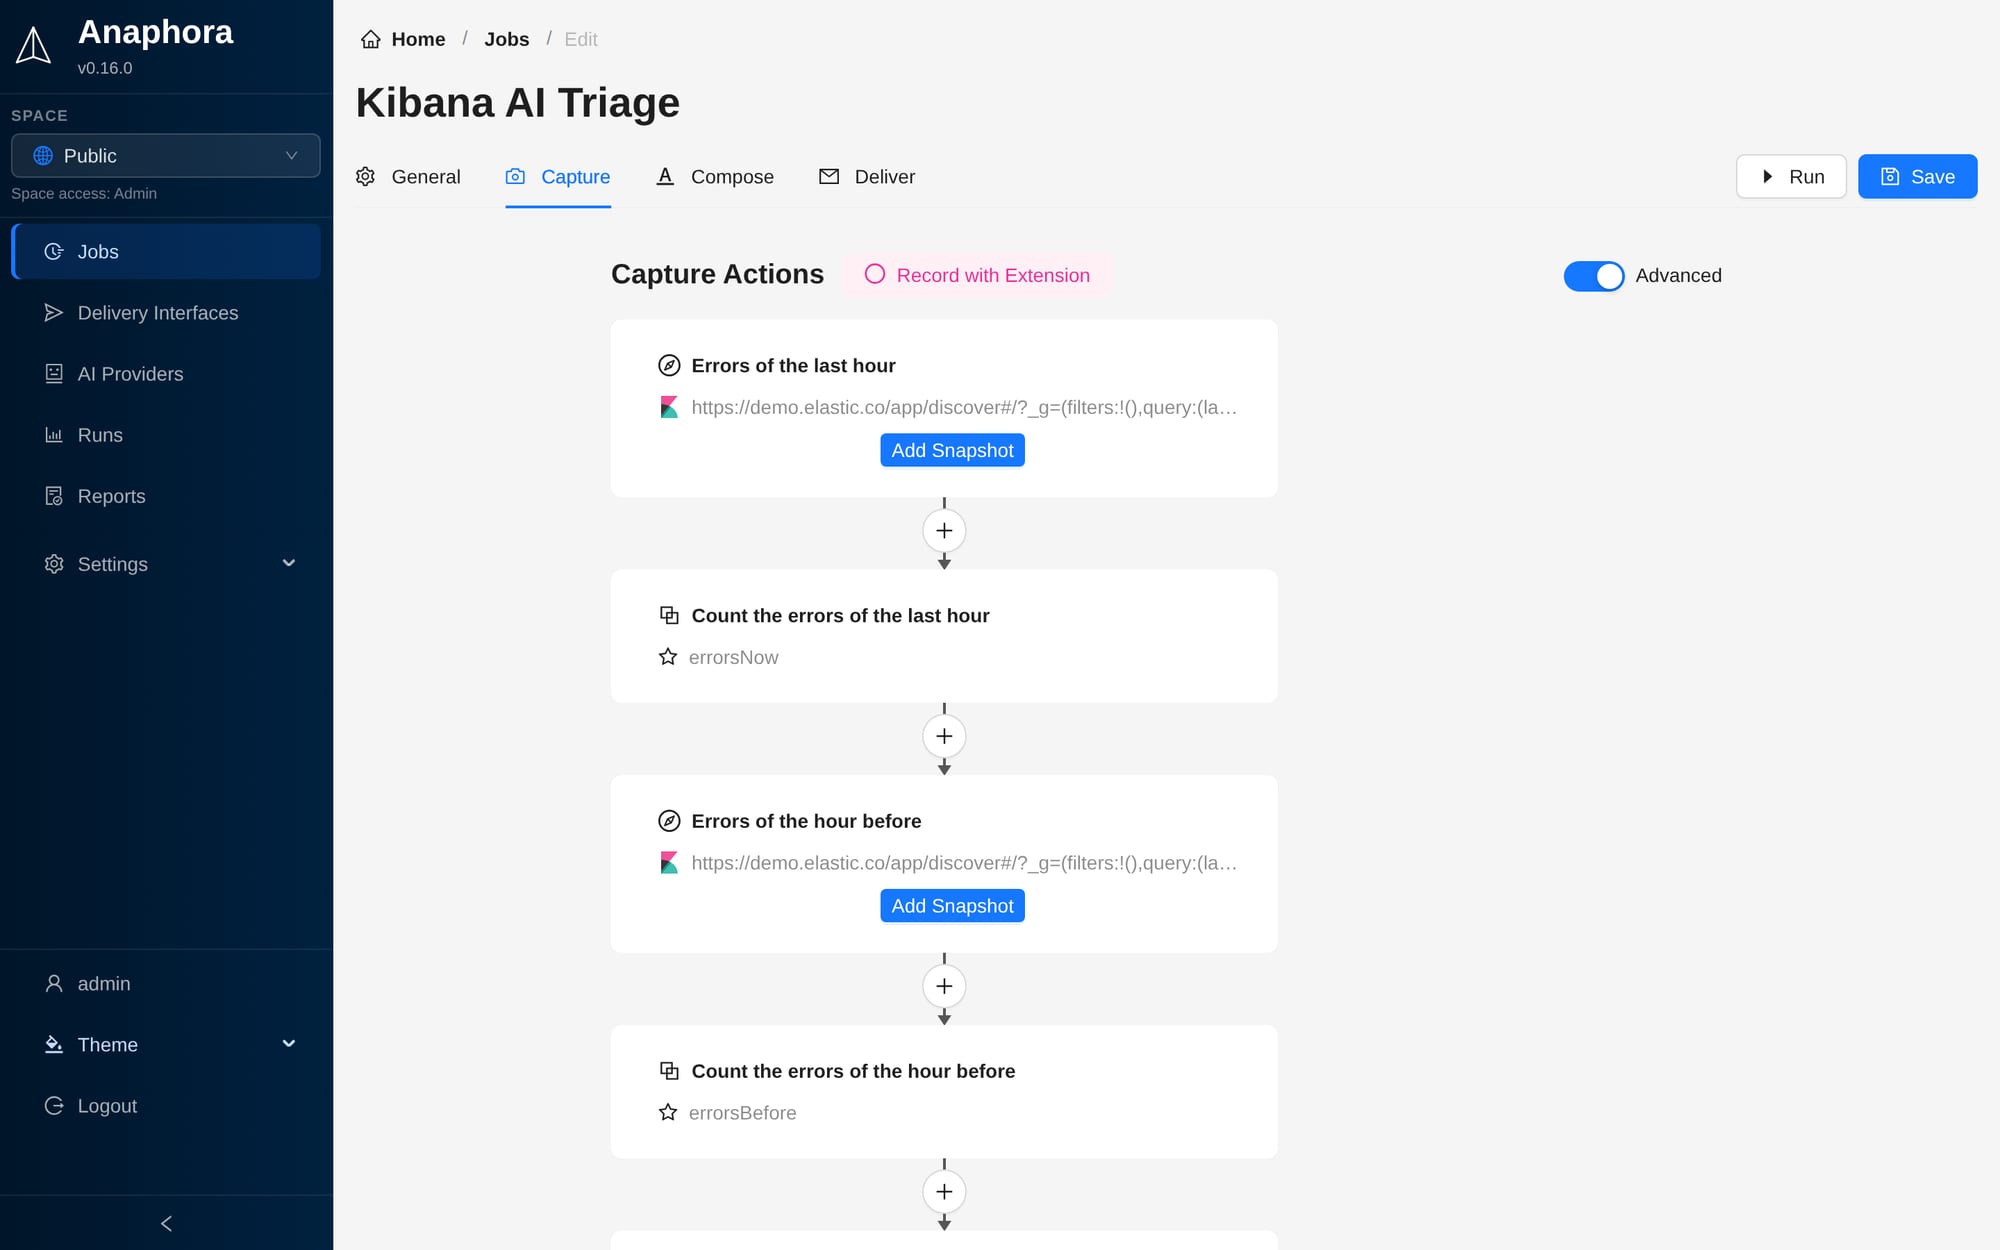
They kept the same dashboards, the same Slack channel, the same engineers. They replaced the rule with an Anaphora job that does what the engineer did, before the engineer.
Every fifteen minutes the job opens Kibana and Grafana like a person would, reads the error count, the traffic curve and the deploy log, and hands all of it to an AI with the three questions above written out in plain English. The AI answers with a severity from 0 to 10. Below 7, the job stops and nobody hears about it. At 7 and above, it writes a four-sentence briefing, attaches the dashboard, and pages the engineer through the same Slack channel as before.
Setting it up took an afternoon. The team started from a template that ships with Anaphora and changed three links. The AI runs on a standard hosted model with a spending cap, and the whole month cost less than a coffee a day.
September
Six night pages.
| What it was | Pages |
|---|---|
| A real failure | 3 |
| The logs stopped arriving | 2 |
| A bad release that did not settle | 1 |
Six out of six needed a human. The 17 traffic surges scored between 2 and 4 and stopped quietly. The deploy blips scored 5, which the team reads over coffee from the run history, where every quiet run still keeps its evidence and its score.
The two "logs stopped" pages are the ones the old rule could never send. Both times the briefing said the same thing: every count is zero, the traffic line ends twenty minutes ago, check the log shipper before the API.
The one that mattered
On the 18th at 02:40, a configuration change broke a connection pool and the partner tracking endpoint started failing. Traffic was flat, at the usual night level, so the old rule would have stayed silent for another forty minutes until the count crossed 200.
The job scored it a 9 on the first run after it began. The briefing the engineer read on her phone:
Server errors rose from 12 to 87 in the last hour while requests stayed at 3,410, so the error share went from 0.4% to 2.6%. The dashboard shows the errors concentrated on the partner tracking endpoint, with the other routes flat. The deployments page shows a configuration change at 02:31, nine minutes before the rise. Check the connection pool settings of that change first.
She rolled the change back at 02:52. Twelve minutes from page to fix, because the first thing to check was in the message.
What this is worth
- Fewer interruptions. 41 pages to 6. Two engineers who were quietly interviewing are not any more.
- Faster fixes. The page carries the diagnosis. Twelve minutes, not forty minutes of silence followed by an hour of looking.
- A failure class that was invisible is now caught. The silent one, where the logs stop.
- No new tools, no new dashboards, no new vendor in the loop. The same Kibana and Grafana, the same Slack. The AI is one step in a job the team already runs, on a provider of their choosing, with a monthly cap.
The warehouse team copied the job the following week. Their dashboards are in Grafana; the flow is the same, only the links changed.
If you want to try it
The template is called Kibana AI Triage and comes with Anaphora. It needs an AI provider, hosted or self-hosted; any OpenAI-compatible endpoint works. Install Anaphora and run the template once against your own dashboards to see the score and the briefing before you connect it to a pager. The use cases page has four more jobs built the same way.
For the engineers: the exact prompt, the capture flow and the token maths are in the AI provider docs.